Integrate LinkedIn Pages into DashThis
First, please note only a business account can be connected to DashThis.
Permissions: In order to successfully connect LinkedIn Pages to DashThis, you need to have a Super Admin role.
If you do not have a Super Admin role, you will not be able to connect your account to DashThis. Should you request Super Admin access, please get in touch with someone in your organization who has access. Not sure who has access?
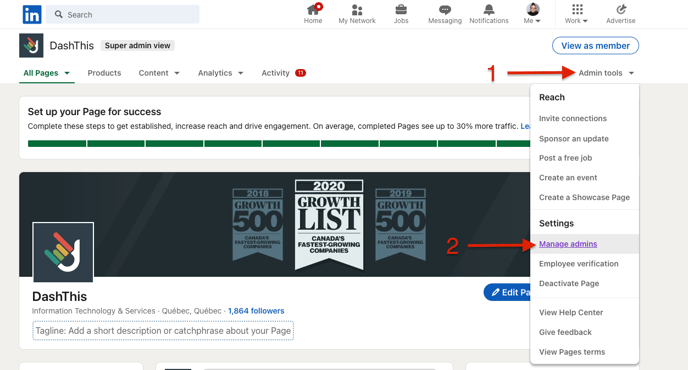
- Go to the Page you manage (on the right of your home page)
- Click on Admin tools (on the right)
- In the drop-down list under settings, click on Manage Admins
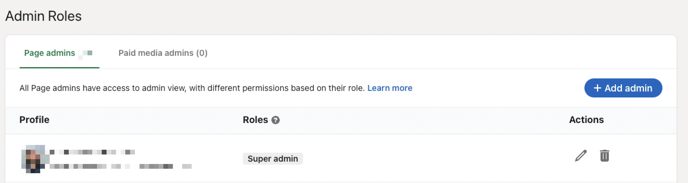
- On this page, you will see a list of users and their access to the business page. If you need to change a user's permission to Super Admin or other, click on the pencil under actions, and set their role accordingly.

How to connect LinkedIn Pages to DashThis:
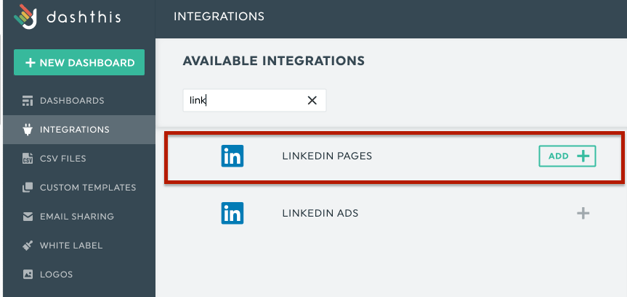
Step 1 - Go to DashThis and click on the integrations page
Step 2 - Scroll down the list of available integrations and click on ADD + beside LinkedIn Pages
Step 3 - You’re then redirected to LinkedIn Pages where you will sign in as usual and allow DashThis to access your LinkedIn Pages data (don’t worry – we only use it to generate your dashboards)
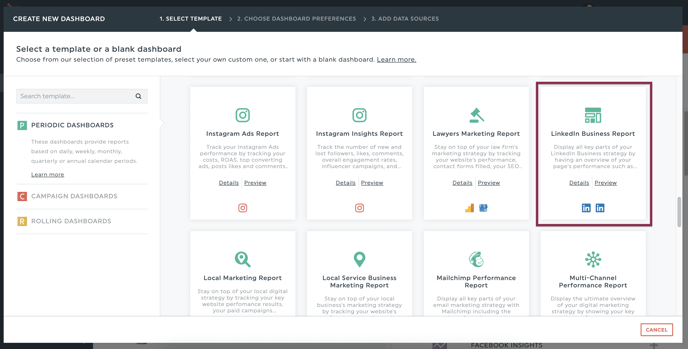
Now you can create reports with LinkedIn Pages 🙌 Not sure which data to import? No problem! We created a periodic dashboard template to help you. Simply go to your Dashboard manager page and click on Create Dashboard, search through the periodic templates or write the integration's name, and find LinkedIn Business Report. This report also includes data for LinkedIn Ads.
Should you need any assistance with LinkedIn Pages, please reach out to our Support Team 🤘
What's next:
LinkedIn Pages metrics and dimensions
LinkedIn Pages notes/limitations