How to create a table widget with CSV data?
There are 6 steps to follow in order to use CSV files in DashThis:
- Get your file ready
- Create the template (CSV Files Manager)
- Link the CSV source to your dashboard(s) (Manage sources)
- Create widgets with the CSV source (Dashboard Editor)
- Upload the CSV data (CSV Files Manager)
- Refresh the dashboard (Dashboard Editor)
Step 1: Get your file ready
Before starting the procedure, make sure your file contains all the necessary information.
1- Customer ID: The Customer ID is the name of your file, and how it will appear in the system. This is equivalent to the source name in other integrations. Your customer ID cannot be a date.
2- Date: The date is the date or the period of time of the file. It needs to include only the year(s), the month(s), and the day(s). The system doesn’t support the time of the day, so be sure it’s not in your file.
If this information is missing or does not meet the requirements stated above, please change the data in the file before uploading it in DashThis.
Step 2: Create the template (CSV Files Manager)
2.1 – Add the template
Go to the CSV Files Manager in the user menu.
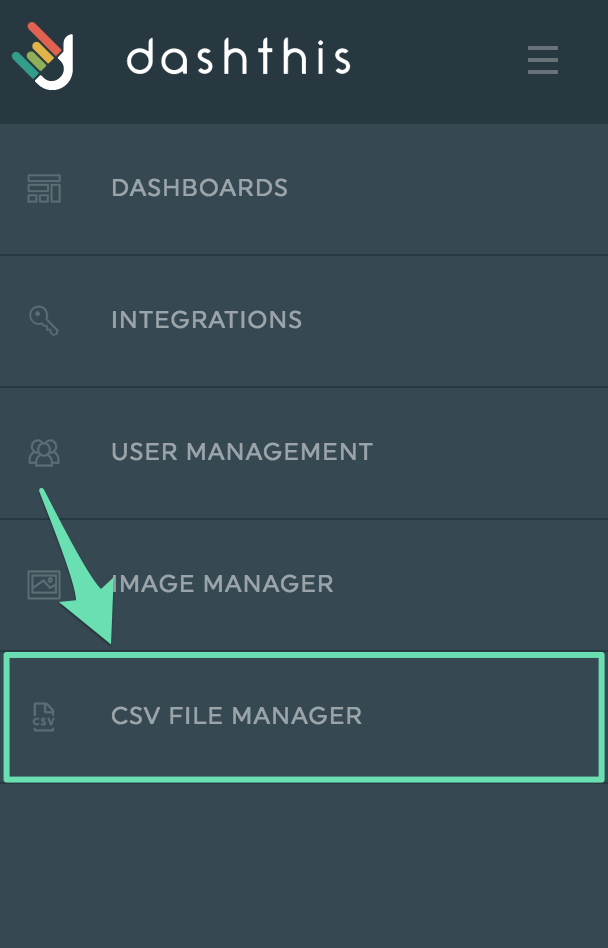

Once in the CSV files manager, click on New Template
Choose your CSV file and upload it. The first screen you see after you’ve uploaded your file should look like this:
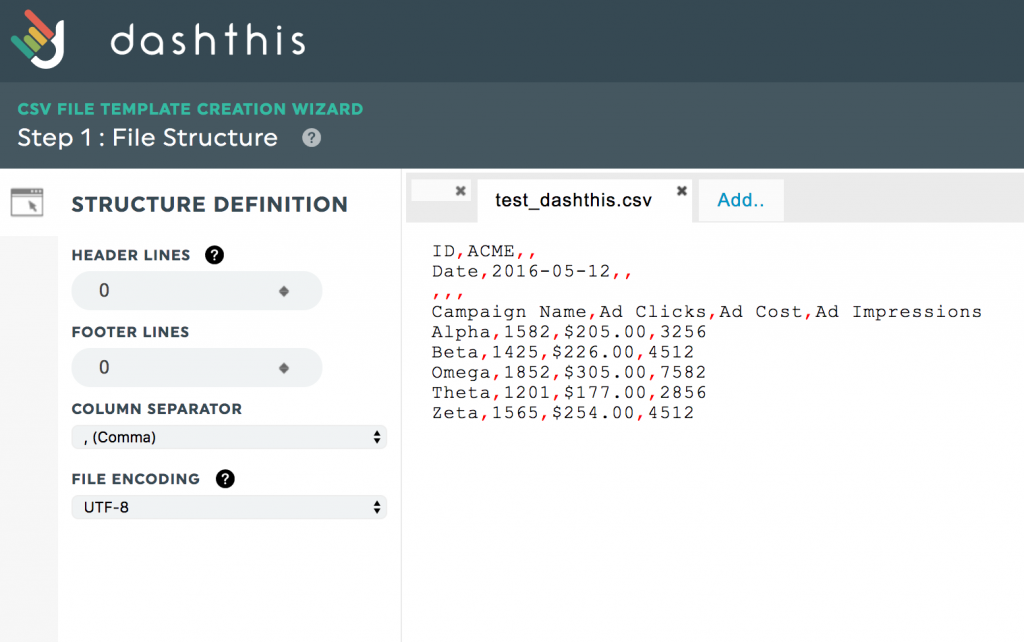
2.2 – File structure
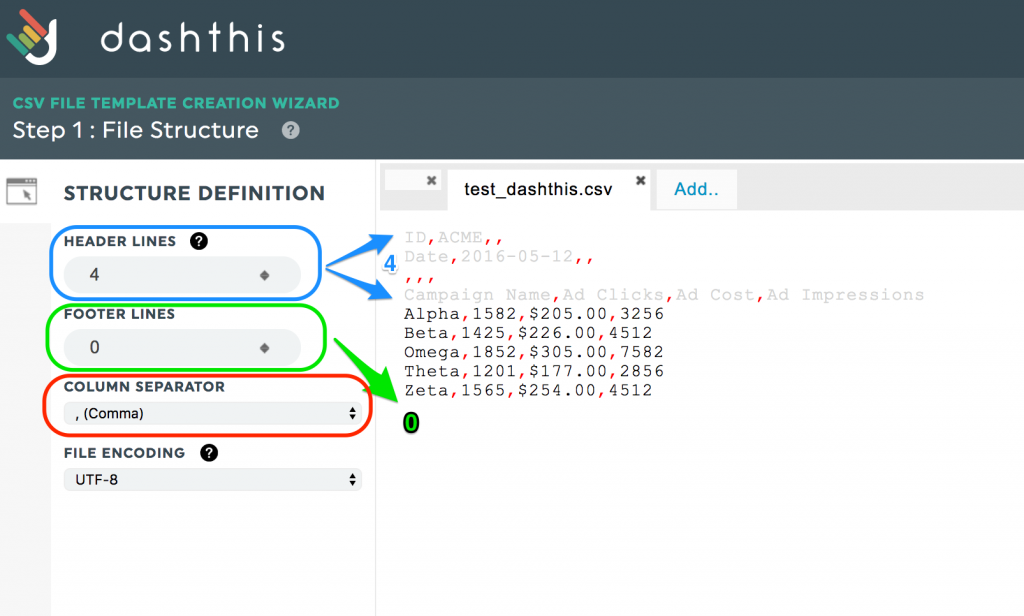
The tool now needs a bit more information about the specific file structure, specifically the number of lines in the headers. This includes the lines containing the column names.
You also need to specify the number of lines in the footer (if any). This includes the lines displaying totals. Enter the column separator (be it comma or semicolon), and the file encoding. You can, of course, use default values.
Done with the file structure? Great! Let’s move on. Click Next.
You now get to see a preview of your file as the system sees it. It should look something like this:
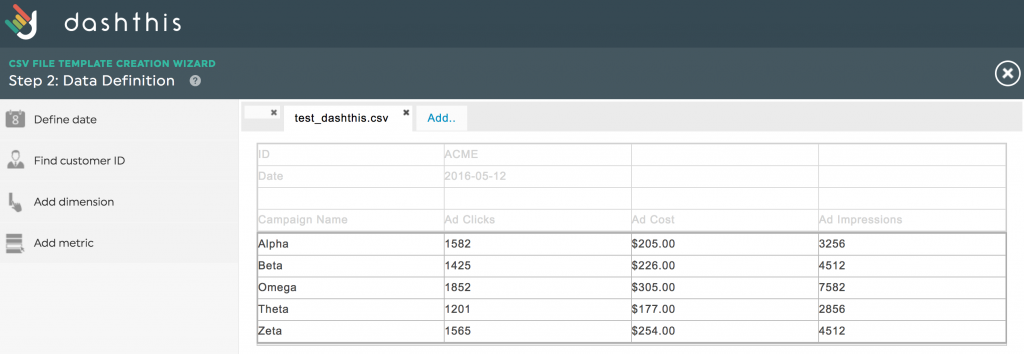
2.3 – Define the fields
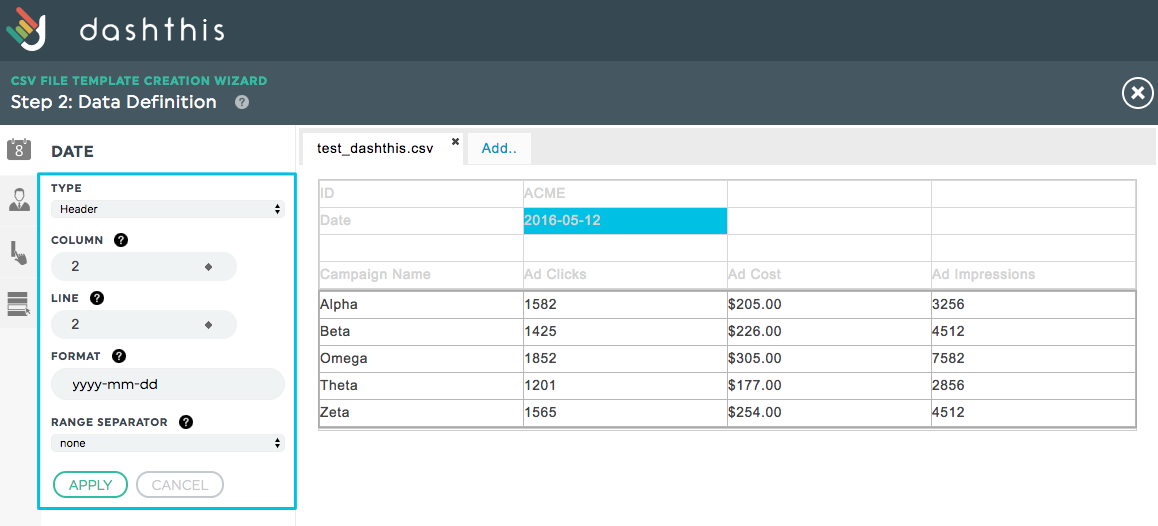
Now, you need to define the date, the customer field, the metrics, and the dimensions.
Defining these fields means you have to indicate to the system where it can find each piece of information in the file. In our example, the date is located within the header, second column, and second line, so you should enter the number “2” in both boxes.
Then, in the box Format, write how the date is presented in the file, so the system knows how to read it. Do not write the actual numbers, just the format. In our example, we would write yyyy-mm-dd in the box.
As far as the range separator is concerned, you need it only if your file covers a period of time, which would mean that you would have two dates in this field, 2016-05-15 to 2016-05-30 for example. If this applies to your CSV file, choose the appropriate sign separating the two dates of the period.
The date can be directly in a header cell OR in a column. If in a column, you will need to change your TYPE from HEADER to Column (header seen below on the left)
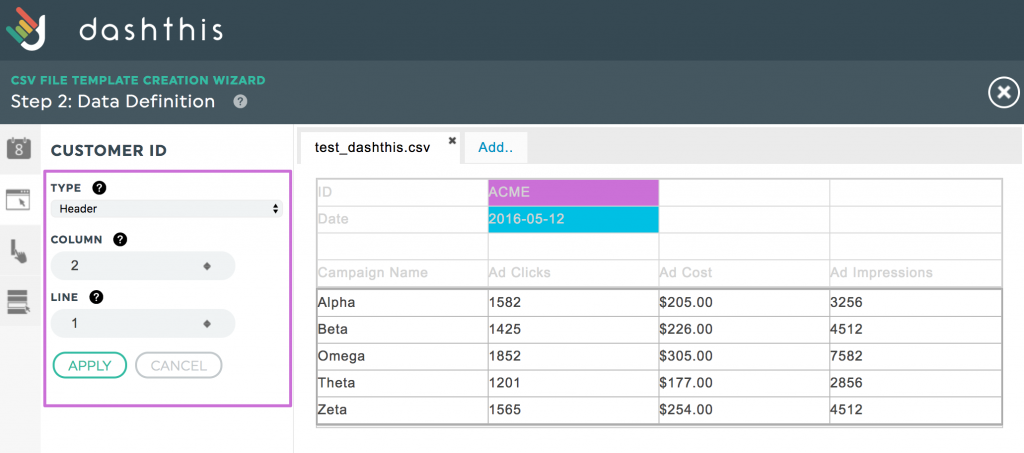
The Customer ID, as said earlier, is the name this source will have in the system. It is comparable to different accounts within another integration.
Later on, the tool will ask you for the Customer ID in order to find the data. This box is case-sensitive, so be sure you write the name the exact same way every time.
The customer ID can be directly in a header cell OR in a column. If in a column, you will need to change your TYPE from HEADER to Column (header seen below on the left)
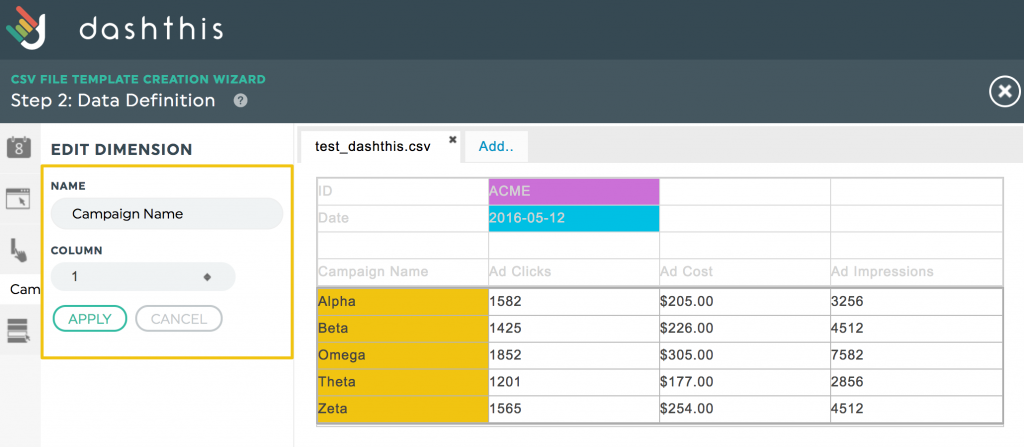
2.4 – Define the data
Now that the header, the date, and the customer ID have been recognized by the tool, we will focus on the actual data. You need to define the different dimensions and metrics by selecting the columns and rows for each piece of information. You also need to specify the type of format of your data (Integer, %, $), and how many digits are displayed after the decimal point, if applicable.
When choosing the % format, pay attention to the way the number is already displayed in your file and choose the right option in the dropdown menu (0.28 in your CSV file displayed as 28% in DashThis, 28% displayed as 28%, or 28 displayed as 28%).
The dimensions:
The metrics:
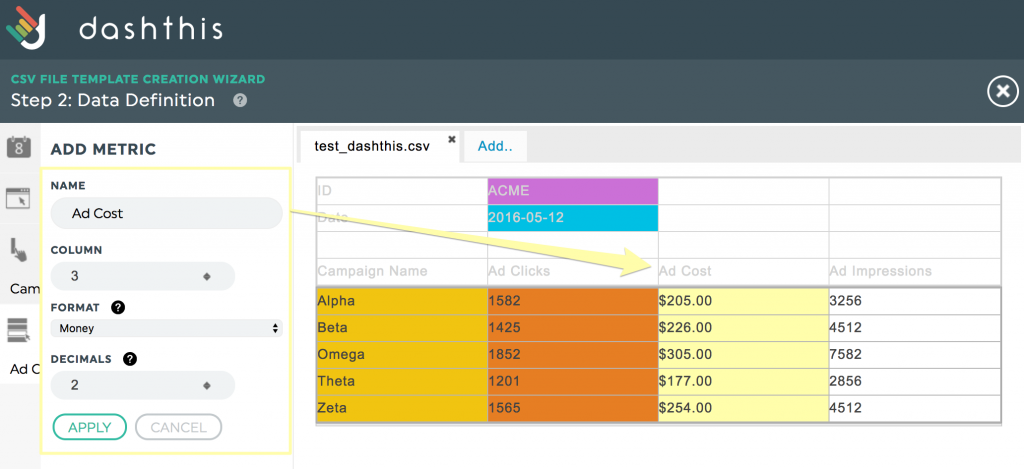
Once you’re done adding all the metrics and dimensions you need, click Save. Give your template a name, and there you go, the template for your CSV file is created!
Step 3: Link the CSV source to your dashboard(s) (Manage sources)
The template is now done, it’s time to create a dashboard using this CSV file. If you want to create a whole new dashboard, the process is similar to a regular one, and you proceed from the main admin panel. Just select your CSV file as a source; you’ll find it in your regular data sources list.
You have already created a dashboard, and want to add the CSV file as a source? Sure! Click on Manage Data Sources on the dashboard:


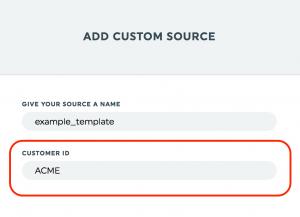
To add a source, you have to specify a key. Remember the Customer ID field you noted before? This is where it goes! In order for the tool to understand, you need to write the Customer ID here in the exact same way you did on your template.
This field is important for the system to find the right data. In our example, we only have one client (ACME), but you could have a template with dozens of CSV files. The Customer ID would then be necessary to filter the one you want.
Step 4: Create widgets with the CSV source (Dashboard Editor)
It is now time to add your widgets using the data from your CSV file. Using the custom widgets menu, you’ll be able to select metrics and dimensions as you would with any other integration. You can proceed as you usually do.
You will notice that your widgets are empty. This is normal. You need to complete Step 5 in order to see the data.
Step 5 : Upload the CSV file’s data
Now that you’ve created your CSV file, your template, your dashboard and dropped some widgets and KPIs onto it, you have to push the data. It means you need to upload the CSV file again, so the tool will send the data to the widgets.
In the CSV Files Manager, select the template you just created on the right, and then select the CSV file. Click on Resend.
** Note that if you add a new widget, you’ll have to upload the data file again **


Step 6: Refresh the dashboard (Dashboard Editor)
The last step is to refresh the dashboard (which can be done by hitting the F5 key on most browsers).
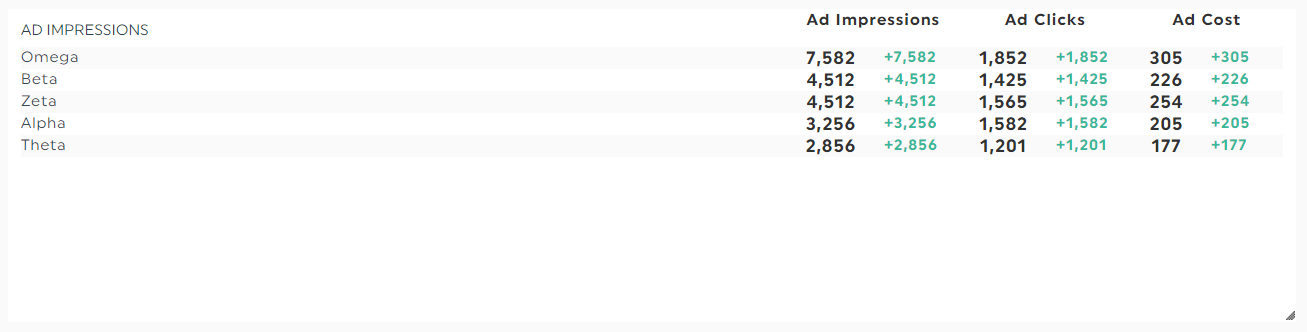
There you go! You have a widget created with data from a CSV file.
Also, don’t forget that the data will only be visible according to the data included in the file. In our example, the date is 2016-05-12, so the widgets having the CSV file as a source will display the data only for the month of May. If you choose the month of December 2016 as a setup for your dashboard, the widgets based on the CSV file will be empty.
The “Send by Mail” function in the CSV files manager
We love making your life easier. That’s why we’ve added the possibility for you to send a CSV file by email to an already-existing template. You don’t even need to be connected to DashThis to do it. How sweet!
What is it?
In the CSV files manager, when you select a CSV template, the button “Send by Email” appears in the header. This function allows you to send a CSV file by email instead of uploading it through our system. Just remember that you can only send a file to an already-existing template.

When you click the button, you’ll get a pop-up with the recipient’s email address that you can copy to your clipboard (the recipient is a specific DashThis mailbox linked to your CSV template). You can paste this email address into a new message in your preferred email manager, attach the CSV file you want to add and click “Send”. That’s it, you’re done!

How you can use it
If it isn’t very different from the “Add a CSV” option, why is it actually there?
Well, we know you have a busy life. This function allows you (or someone else!) to add a CSV file from anywhere. You can just save the email address provided and keep it in your files. When you need to add a new CSV file to your dashboard, you don’t have to connect to DashThis to keep your data up to date. You can also share it with a colleague and this person can send the CSV file without needing access to your account.
Another great way of using the “Send by Mail” function is with another platform. If you receive CSV files from a service or platform that offers automatic sending, you can provide the email address from the “Send by Mail” function, and the CSV files will automatically be sent to your template in DashThis. You don’t even have to think about it! For example, if you’re using MS Outlook, you can send file updates automatically directly from there (here’s some info on how to do it: https://www.msoutlook.info/question/236).
One last thing: “Send by Mail” is a totally different function than “Resend”, that you find next to every CSV file. “Send by Mail” adds a new CSV file to your template, while “Resend” will push the data from that specific CSV file to your dashboards.
Note: It’s only possible to import data from a CSV File into DashThis.
Exporting your DashThis dashboards to CSV is not supported — you can only export them as PDF files.
Need help with your CSV File?
Contact our Support Team here 💪🏼
What's next:
How to create a table widget with CSV data?
How to create a dashboard with AccuRanker using CSV
The CSV File Manager: the possibilities.
What are differences between the table widget and advanced features of CSV files?