- Help Center
- Widgets
- Widget Types
-
Getting Started
-
Integrations
- Adform
- Ahrefs
- Bing Ads
- CallRail
- Campaign Monitor
- CSV
- Campaign Manager 360
- Facebook Ads
- Facebook Insights
- Google Ads
- Google Analytics
- GA4
- Google My Business
- Google Search Console
- Google Sheets
- HubSpot
- Instagram Insights
- Instagram Ads
- Keyword.com
- Klaviyo
- LinkedIn Ads
- LinkedIn Pages
- Mailchimp
- Marchex
- Moz
- Perfect Audience
- SEMrush
- Shopify
- TikTok Ads
- Webceo
- Youtube
-
Dashboards
-
Widgets
-
Account
-
Got a question?
How to show multiple KPIs in a single Trend widget?
The Trend widget is a great way to show your data compared to all its history. It's also a great way to show multiple KPIs compared together overtime.
While being in your dashboard Edit Mode, here are the following steps to add multiple KPIs in a single Trend widget:
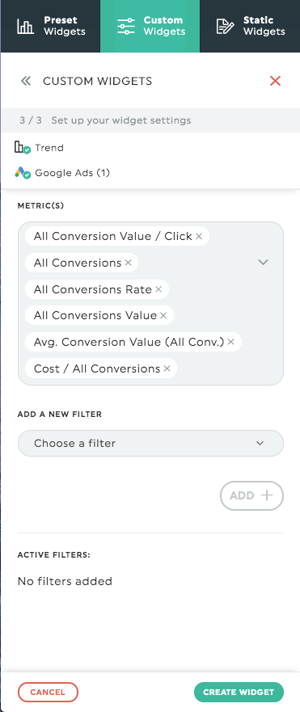
- Open the Custom Widgets panel.
- Select the Trend widget from the menu.
- When choosing your KPIs, you can add up to 6 metrics in your widget.
- Create your widget!
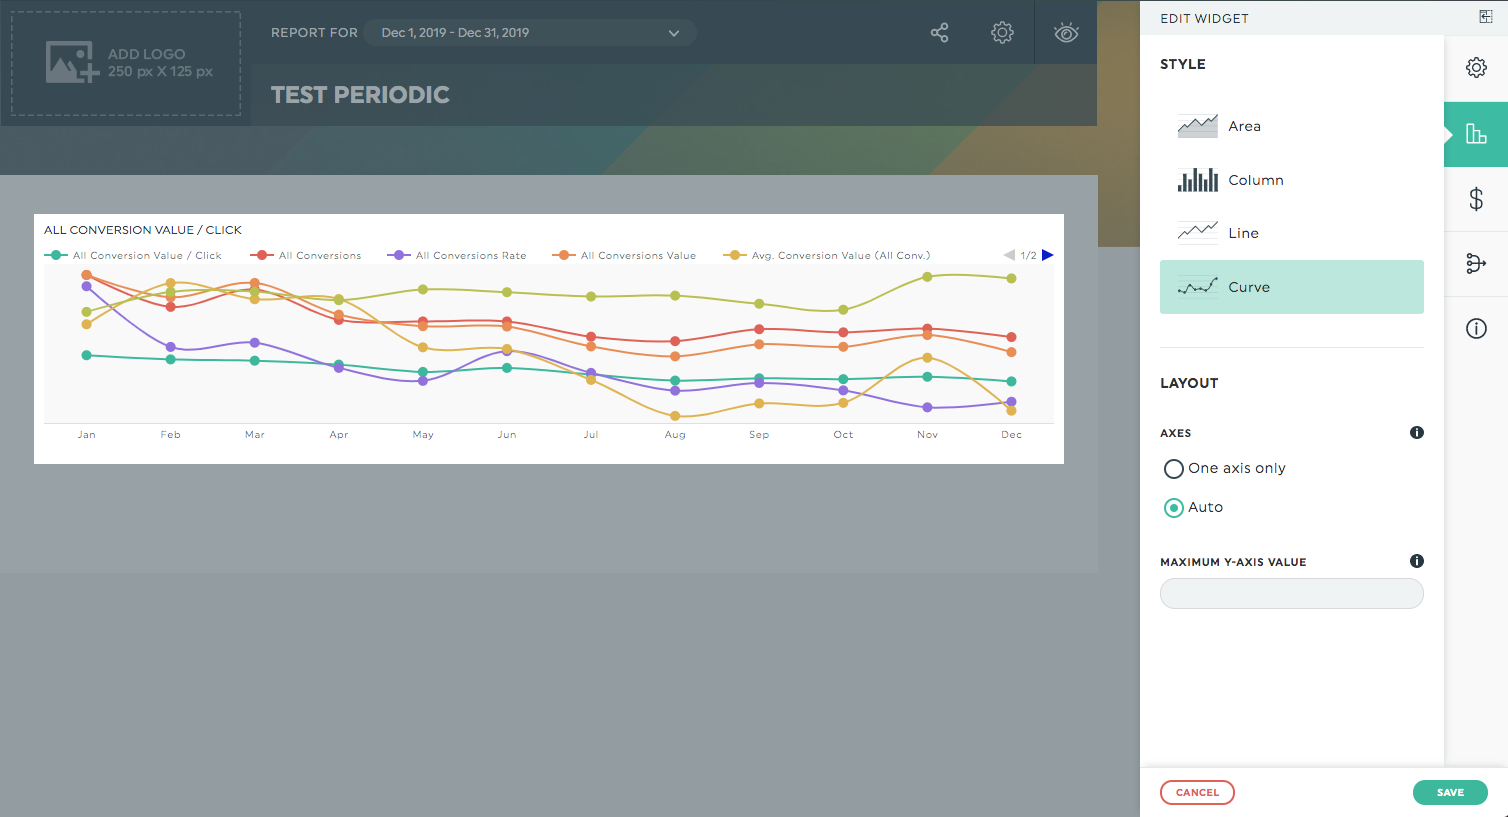
Later, when editing your widget, you can even change the graph type to display lines instead of columns.