While being in your dashboard Edit Mode, here are the following steps to add multiple KPIs in a single Trend widget:
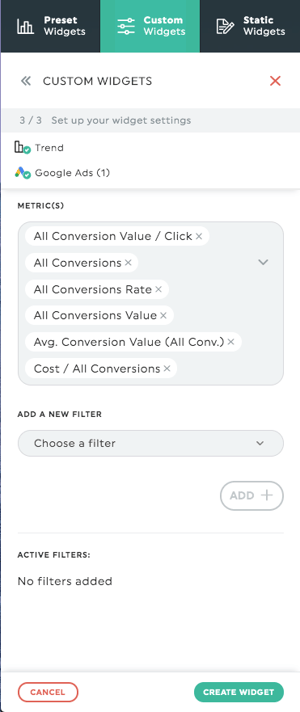
- Open the Custom Widgets panel.
- Select the Trend widget from the menu.
- When choosing your KPIs, you can add up to 6 metrics in your widget.
- Create your widget!
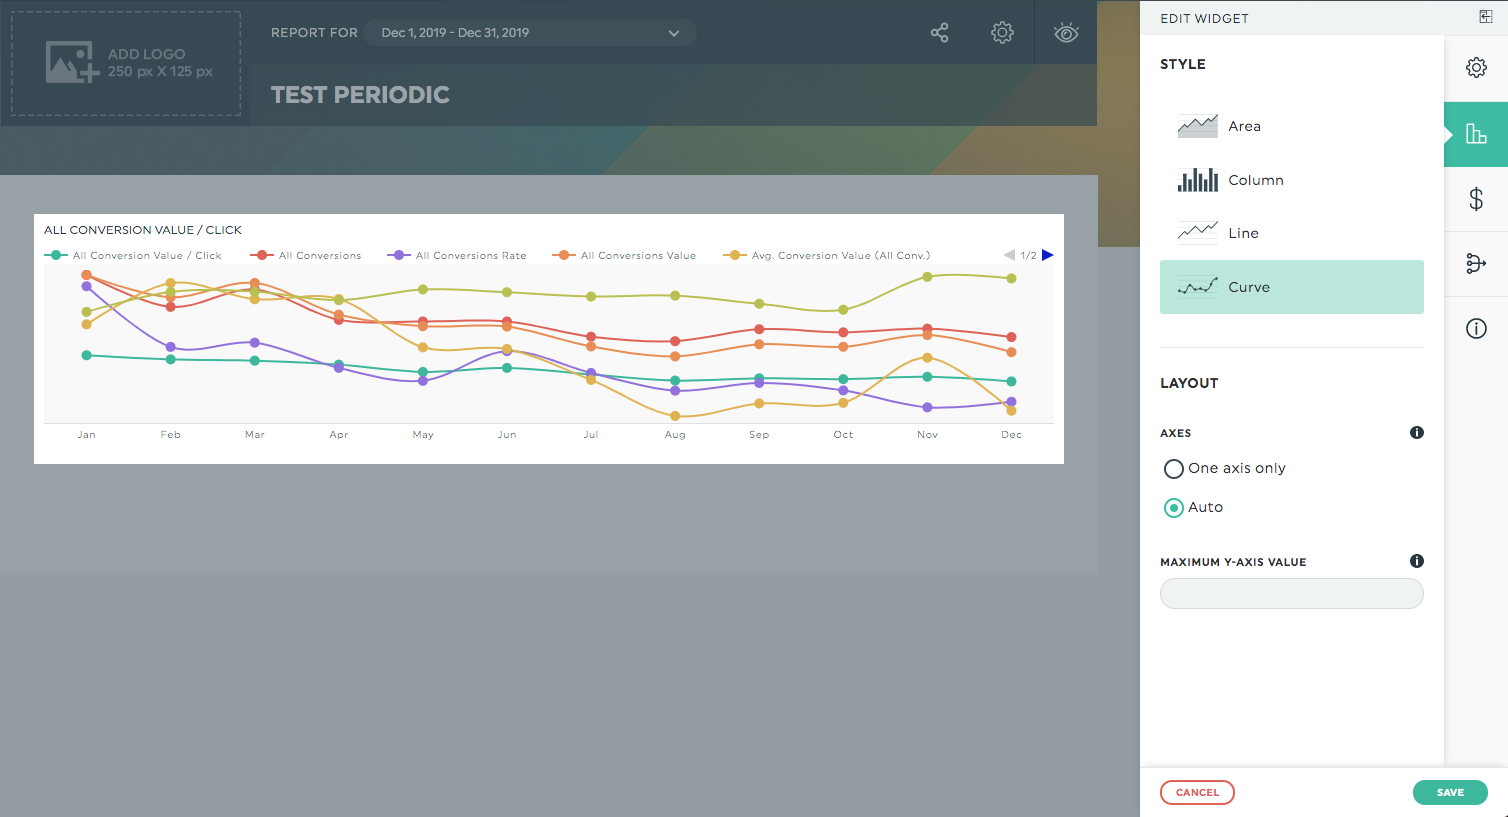
Later, when editing your widget, you can even change the graph type to display lines instead of columns.