1. Dashboard access errors (e.g., 404)
(These errors do not appear in the Errors Panel)
If you see a 404 error when opening a dashboard link, it means that the dashboard has been deleted or is no longer available.
If you believe this is a mistake, please contact our Support Team. We can validate the situation for you and, when possible, recover accidentally deleted dashboards. Although recovery is not always guaranteed, most dashboards can be restored.
2. How to identify errors inside a dashboard
When an error affects your dashboard, the impacted widgets will turn red and display an error message.
To see all errors in your dashboard:
-
Click See more details inside any affected widget
→ This opens the Errors Panel.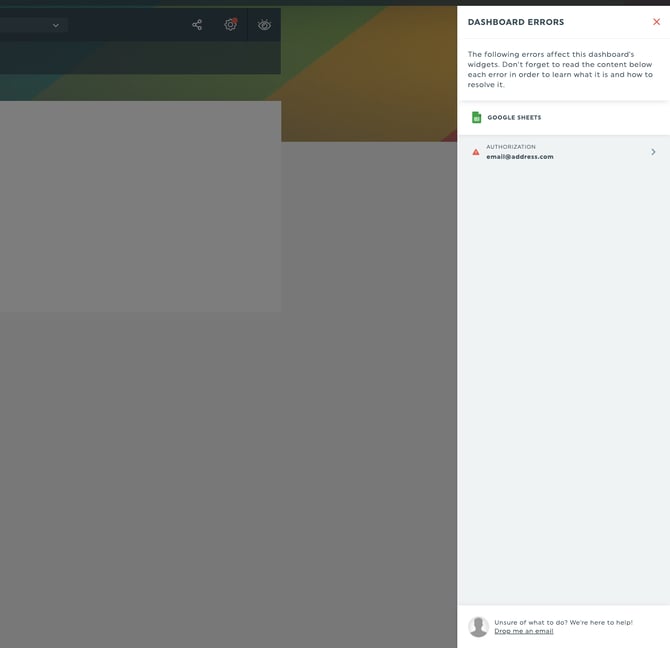
-
Review the list of all errors affecting your dashboard.
-
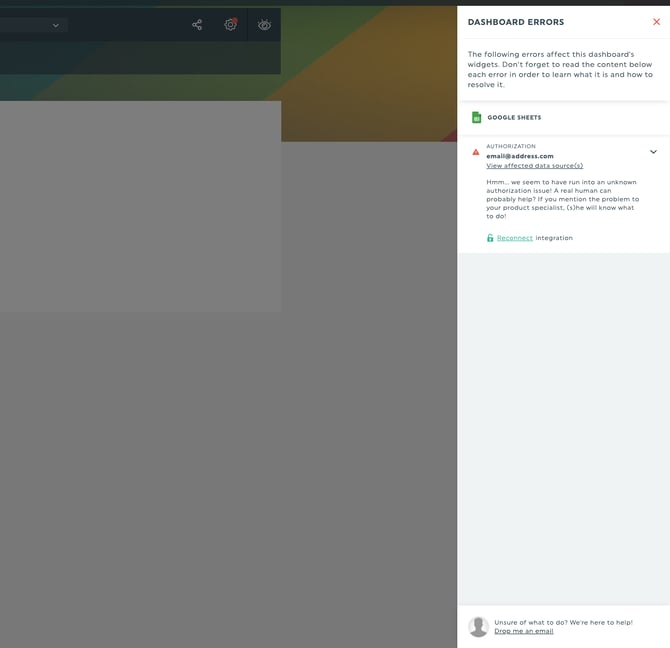
Open each error drawer to view the complete error message and recommended action.
-
If needed, check your integration’s platform (e.g., Google Analytics, Facebook, Google Ads) to confirm the cause.
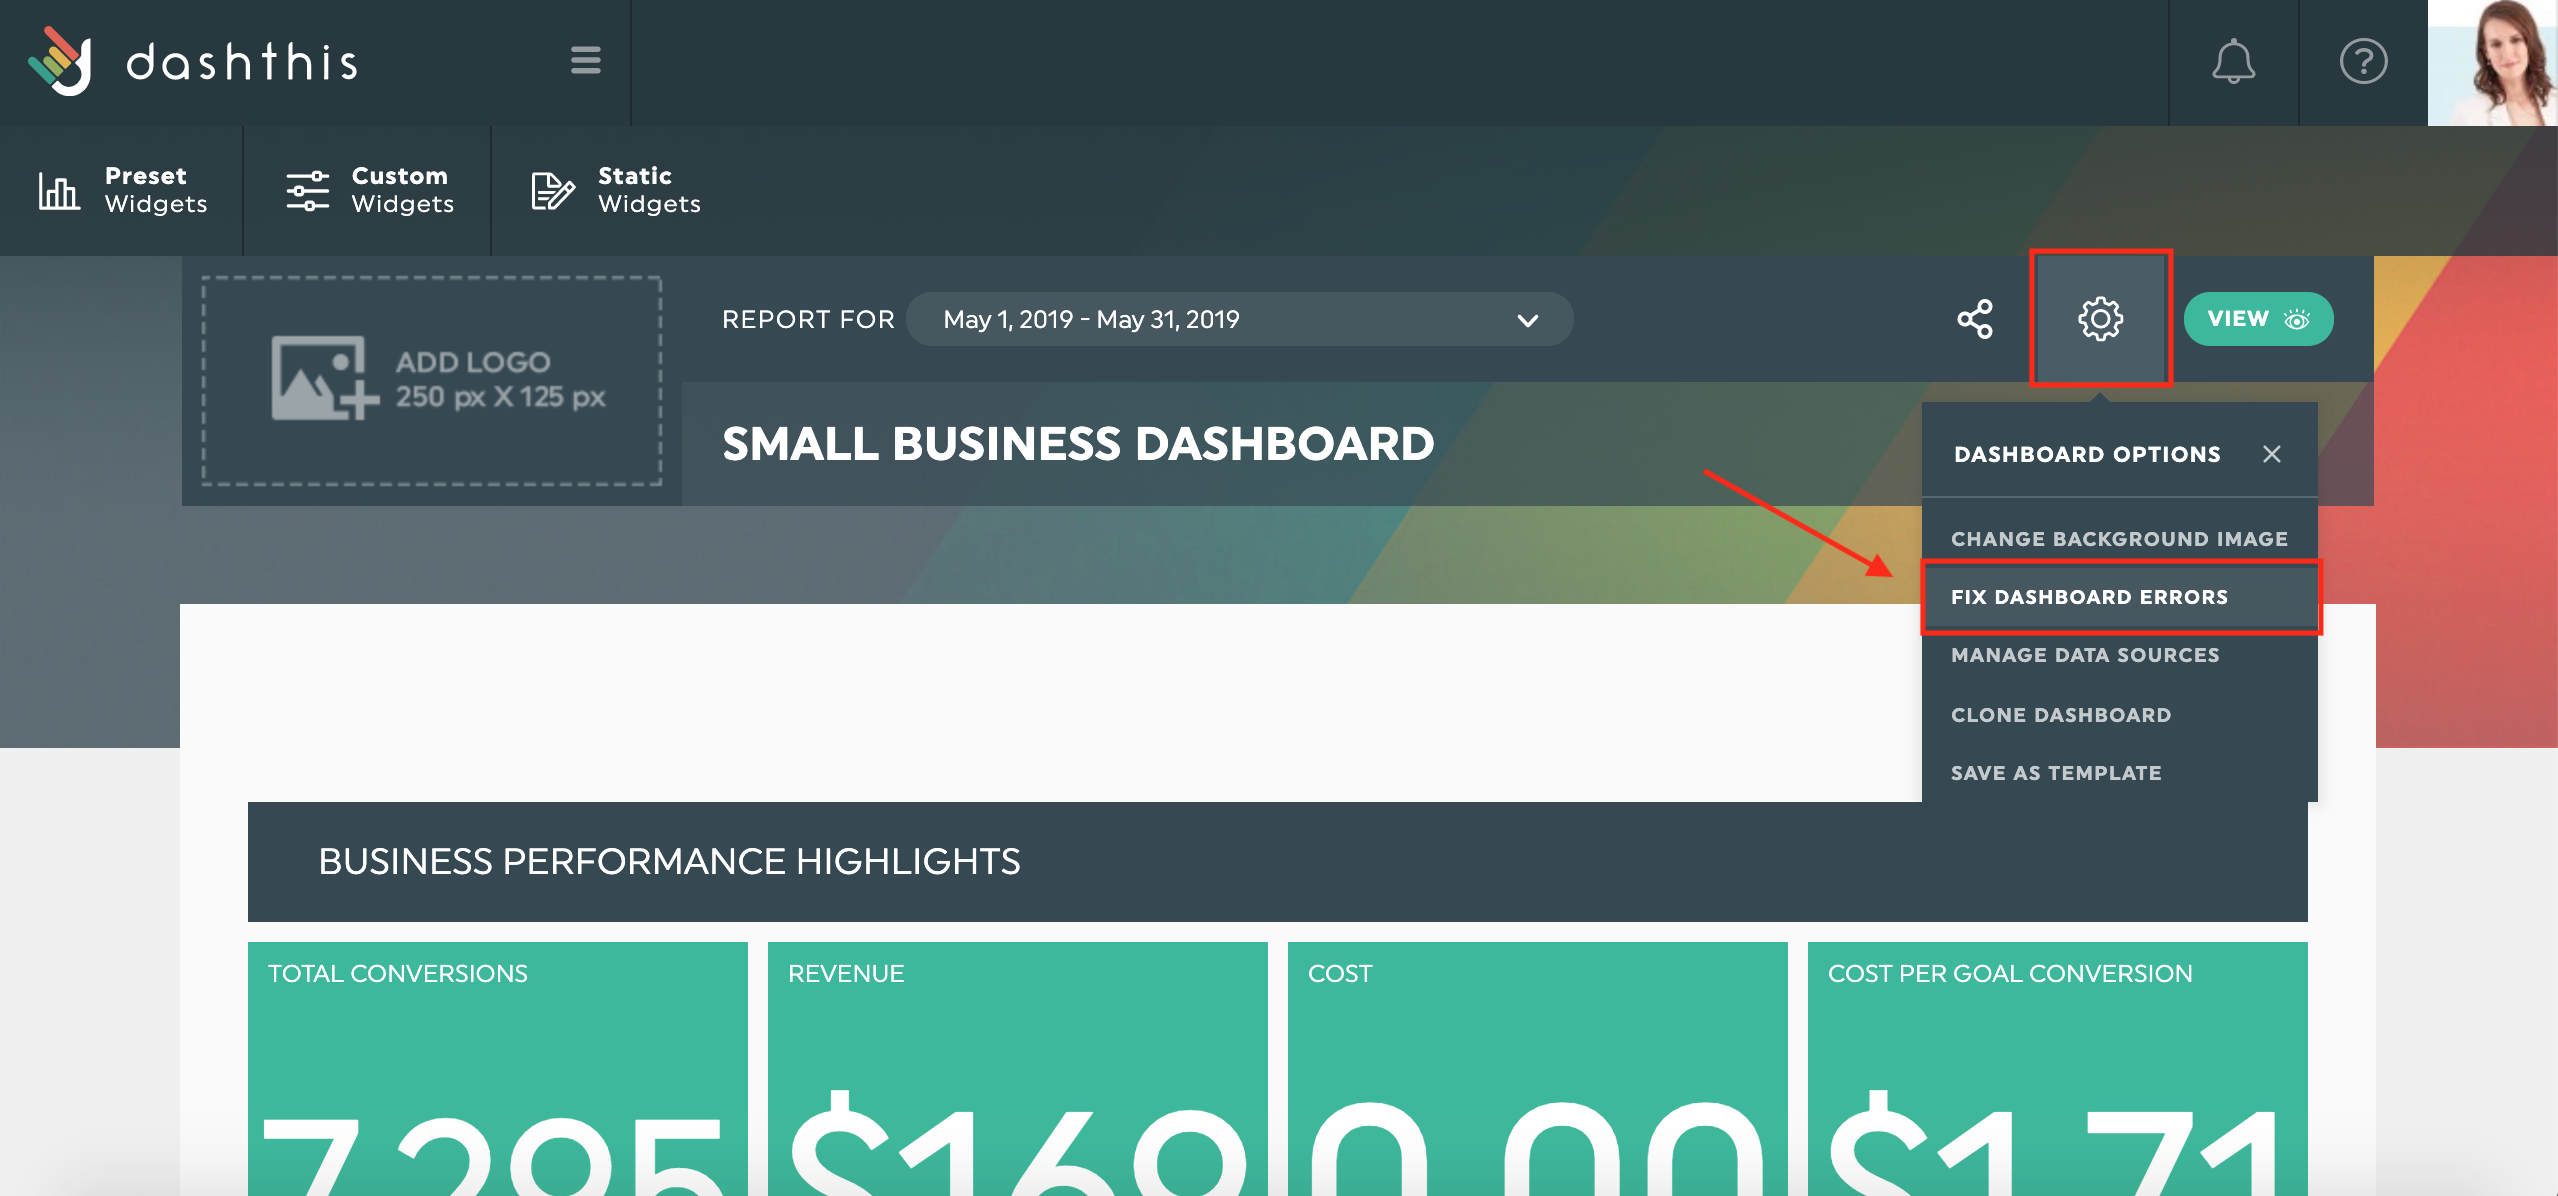
You can also access the Errors Panel at any time by clicking on your Dashboard options and selecting Fix dashboard errors.
3. How to resolve dashboard errors
Before diving into specific error types, try using Refresh data by hovering over the widget.
This reloads the widget’s data and can quickly resolve temporary issues.

If the problem persists, your error will fall under one of these five categories:
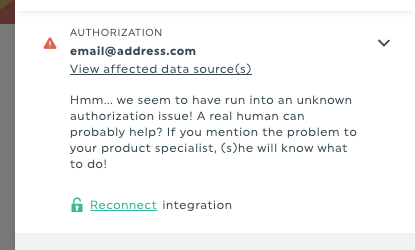
1- Authorization error
What it means:
DashThis can’t access the integration because the authorization (credentials) is no longer valid.
Most common causes:
-
Expired access token
-
Password recently changed
-
Insufficient permissions
-
Security verification required in the platform
How to fix it:
Reconnect your integration.
In some cases, you may also need to log into the integration’s platform to confirm your credentials or complete a security step.
2- Source error
What it means:
DashThis can’t access the selected data source (e.g., Google Analytics view, Facebook page, Google Ads account).
Most common causes:
-
You lost access or permissions to the data source
-
You are using a viewer role instead of admin/editor
-
The account was suspended for payment or security reasons
-
The selected source no longer exists
How to fix it:
Restore your access or permissions directly in the integration platform, or reconnect using an account that has the required level of access.
3- Widget error
What it means:
There's an issue in the widget’s configuration.
Most common causes:
-
Incompatible combination of metrics, dimensions, or filters
-
Invalid or outdated filter
-
Non-supported setup in the integration’s API
How to fix it:
Edit your widget and adjust its metrics, dimensions, and/or filters until you find a valid combination.
4- API error
What it means:
The integration’s API is sending an error back to DashThis.
Most common causes:
-
You’ve reached the API’s data request limit
-
The API is temporarily unavailable
-
Temporary outages or instability on the platform’s end
How to fix it:
Wait a few minutes or hours and try again, depending on the integration.
If the API is down, it will start working again once the platform resolves the issue.
5- Generic error
What it means:
An error was returned by the API, but its exact cause couldn’t be identified.
This type of error usually consists of a random alphanumeric code (ex: 85690de8).
How to fix it:
If you see a generic error, contact our Support Team.
We will investigate the issue for you.

💬 Still need help?
Contact our Support Team here 💪🏼