In each Google Analytics (Universal) view, you can create up to 20 custom goals, and measure insights on it, like the Completions or the Conversion Rate.
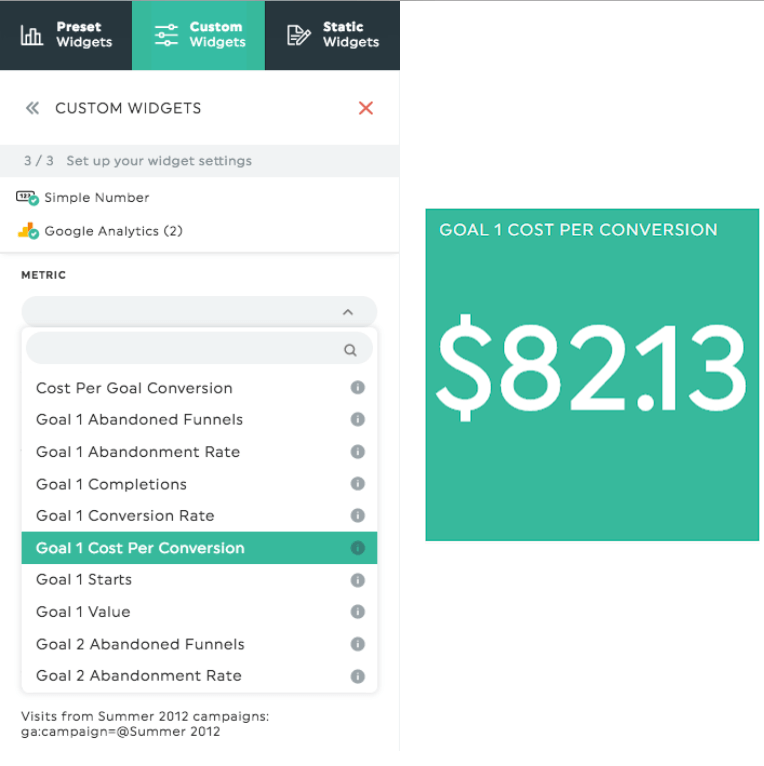
These KPIs are available in the Google Analytics (Universal) integration in DashThis. When creating a Custom Widget, you have access to all KPIs related to your goals:
- Abandoned Funnels: The number of times visitors entered the goal funnel but did not complete a conversion.
- Abandonment Rate: The rate at which the goal was abandoned (the ratio of Abandoned Funnels to Goal Starts).
- Completions: The number of goal conversions.
- Conversion Rate: The percentage of sessions that resulted in a goal conversion.
- Cost per Conversion: The cost per goal conversion for your site.
- Starts: The number of entrances into the goal funnel.
- Value: The monetary value of goal conversions.
These metrics are available for each of the 20 goals, but also for the aggregated value of all goals together.
In order to select the right metric, you simply need to know the number of the goal you want to measure.

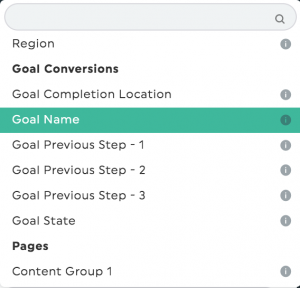
You also have the option to breakdown the results of your widget with goal-related dimensions, in order to compare the performance of your different goals.


